| Active with remarks |
|---|
| This application needs additional settings. Please follow the documentation below to create your own connectionUnique, active service acces point to a network. There are different types of connections (API key, Oauth…). More. |
The Cyfe moduleThe module is an application or tool within the Boost.space system. The entire system is built on this concept of modularity. (module - Contacts) More allows you to create and analyze metrics to study the performance of your domain traffic in your Cyfe account.
Prerequisites
-
A Cyfe account
In order to use Cyfe with Boost.spaceCentralization and synchronization platform, where you can organize and manage your data. More IntegratorPart of the Boost.space system, where you can create your connections and automate your processes. More, it is necessary to have a Cyfe account. If you do not have one, you can create a Cyfe account at cyfe.com.
![[Note]](https://docs.boost.space/wp-content/themes/bsdocs/docs-parser/HTML/css/image/note.png) |
Note |
|---|---|
|
The module dialog fields that are displayed in bold (in the Boost.space Integrator scenarioA specific connection between applications in which data can be transferred. Two types of scenarios: active/inactive. More, not in this documentation article) are mandatory! |
![[Note]](https://docs.boost.space/wp-content/themes/bsdocs/docs-parser/HTML/css/image/note.png) |
Note |
|---|---|
|
There is no connection required for pushing value to your Cyfe account from Boost.space Integrator. You can directly use the widget’s API End Point and push a value from Boost.space Integrator. |
-
Login to your Cyfe account.
-
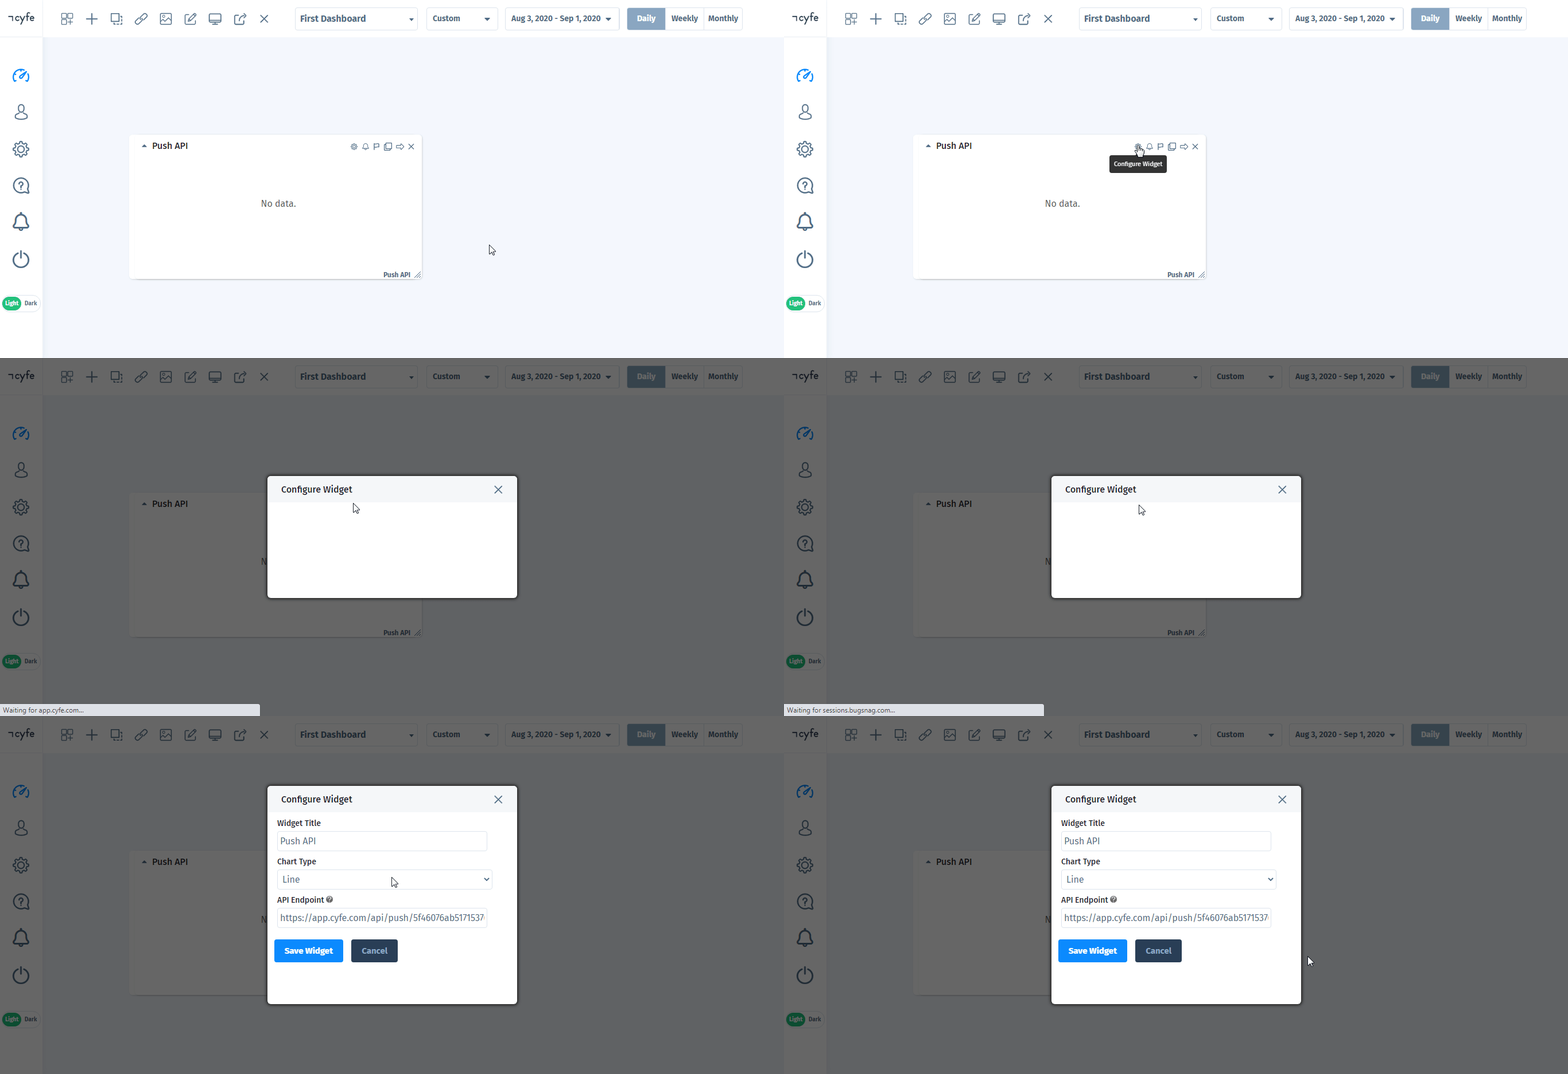
On the widget for which you want to push value, click the Setting icon (
 ), and copy the API Endpoint value to your clipboard.
Pushes your data into a push API widget.
|
API Endpoint |
Enter the API Endpoint of the widget whose event data you want to push. See Accessing Cyfe Widget’s API Endpoint above. |
|
Metric |
Enter the metric to which you want to push the value. |
|
Date |
Enter the date in YYYY-MM-DD format. |
|
Value |
Enter a JSON string containing the data you want to push. |
|
Replace |
Select whether to replace the value if during subsequent calls a data is pushed in with the same element name, existing values are added to the new value by default:
|
|
Color |
Select the color for the metric. |
|
Cumulative |
Select whether you would like to see cumulate values for the specified metrics in the widget header:
|
|
Average |
Select whether to display averages for the specified metrics in the widget header:
|
|
Reverse |
Select whether high values are good or bad for particular metrics:
For example, large number of unlikes count on Facebook is bad. |
|
Reverse Graph |
Select whether you want to display a graph upside down:
For example, when displaying ranking information. |
|
Y-axis |
By default, each metric you add to the widget falls on its own y-axis. You can enable a single y-axis across all your metrics in the widget thereby syncing the data. Choose the value |
|
Y-axis Minimum |
Enter the minimum value of the Y-axis. |
|
Y-axis Maximum |
Enter the maximum value of the Y-axis. |
|
Show Y-axis |
Select whether to turn on the Y-axis for the metric:
|
|
Show LabelsA label is a “tag” that can be added to items within a module. It's a flexible tool used to categorize and organize data, making it easier to customize workflows and processes. More |
Select whether to turn on the data labels for the metric:
|
